Candlesticks aren’t magical fortune-tellers that will tell you what the market is going to do. They don’t have special powers and are not the only way to see market information.
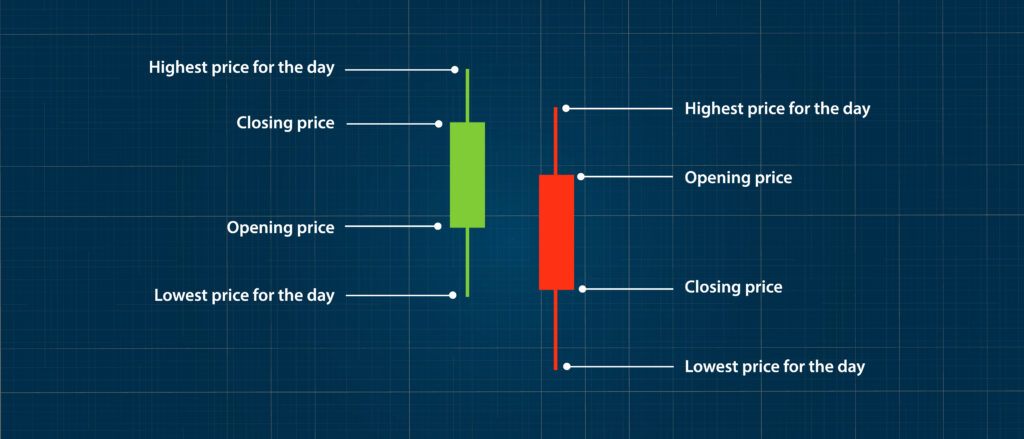
Candlesticks are a tool. They show you what happened during a trading session, whether it is a daily candle or a 10-minute candle. They reveal where the price has been during the session. This includes the open, close, high, and low of the session. A candle shows a picture of the pricing war that took place in the session.
The most important information in any candle is the closing price — this is where traders establish the price by the end of all their trading. It contains the truth after all their fighting and noise. The close determines the color of the candle (red or green). The closing price affects all other indicators you might be watching. Did it close higher or lower? That is what the indicators are waiting for as they calculate how the close relates to all the previous closing candles.
As a beginning trader, I dutifully learned all the candlestick signals. I expected a payoff merely from knowing what the so-called “reversal” candles looked like. And in my simplicity, I purchased stocks after seeing one of these signals. But the directions seemed to change without warning, and I was left with a stock I didn’t want and didn’t seem to care about my candle pattern accuracy.
I had to go beyond candlesticks, even though I’d learned to read them well Levels based on technicals of the chart must be recognized, or possibly even drawn, if it helps you visualize them. Knowing where the key levels are located, you can anticipate where exactly candlestick signals should occur. This puts the tool of candlesticks in its proper place.
It takes a while to learn where that proper place is. It isn’t that candles are useless or unimportant, it’s that knowing the psychology behind them and what they mean by the place they occur is more important than memorizing signals. Knowing a candle is “good” if you want the stock to go up doesn’t help you much if you don’t also know the context of that price level. Hammer = Reversal is only helpful if you know how long the reversal might last and to which resistance level.
I use a basic “rule of 5.” This means that I expect any given candle signal to indicate the probable direction of the next 5 candles. I apply this rule of 5 to any time horizon, whether 5-minute day trading candles or daily. The important thing is not the number 5, this could be a rule of 7 or whatever you like, but rather the idea that you shouldn’t expect it to reveal a bias for more than the next few candles.
Now I use candlesticks to understand recent price action and potential support levels that are formed by the signals on the spot. The rule of 5 gives me a directional bias in the short-term, and I use that information along with my analysis of major levels of support and resistance. If the signal occurs at a major level, so much the better. If not, I consider that the signal itself might be revealing a new support level, which may be temporary and may not hold, same as any support level.